Monitor & Troubleshoot Hyper-V Performance
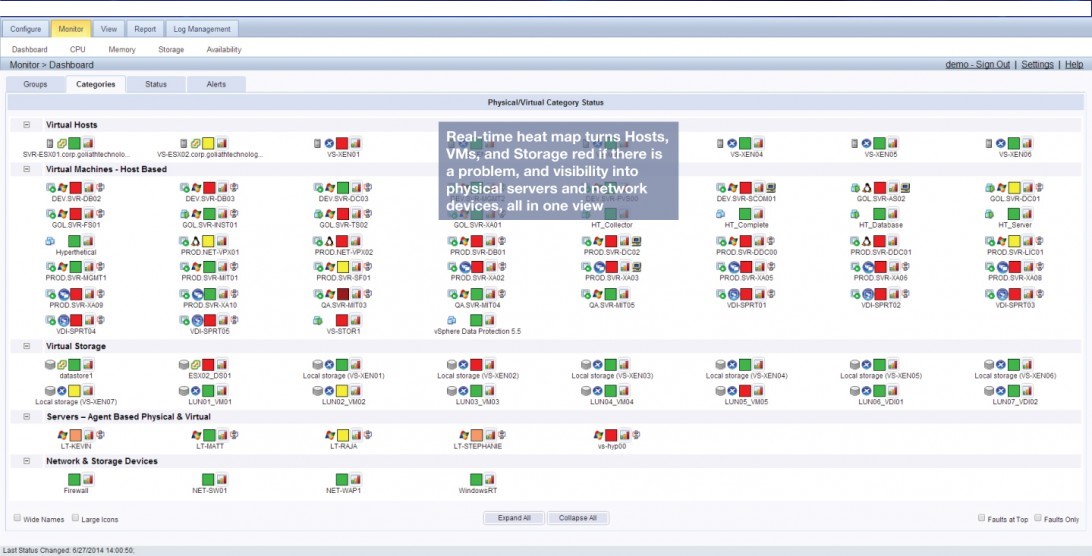
Goliath Performance Monitor allows an administrator to have one console for monitoring the Hyper-V Host, VM’s, Applications, OS, and Hardware. It includes comprehensive alerting on thresholds, events, and faults which allows for proactive management of Hyper-V infrastructure. You can now improve application availability and eliminate blind spots and false positives, while reducing the complexity of your Microsoft Hyper-V virtual environment.
Goliath for Hyper-V Features Include:
One product for Hyper-V Host, VM’s, Applications, OS, and Hardware Performance Monitoring
Comprehensive alerting on thresholds, events, and faults
Proactive remediation sequences
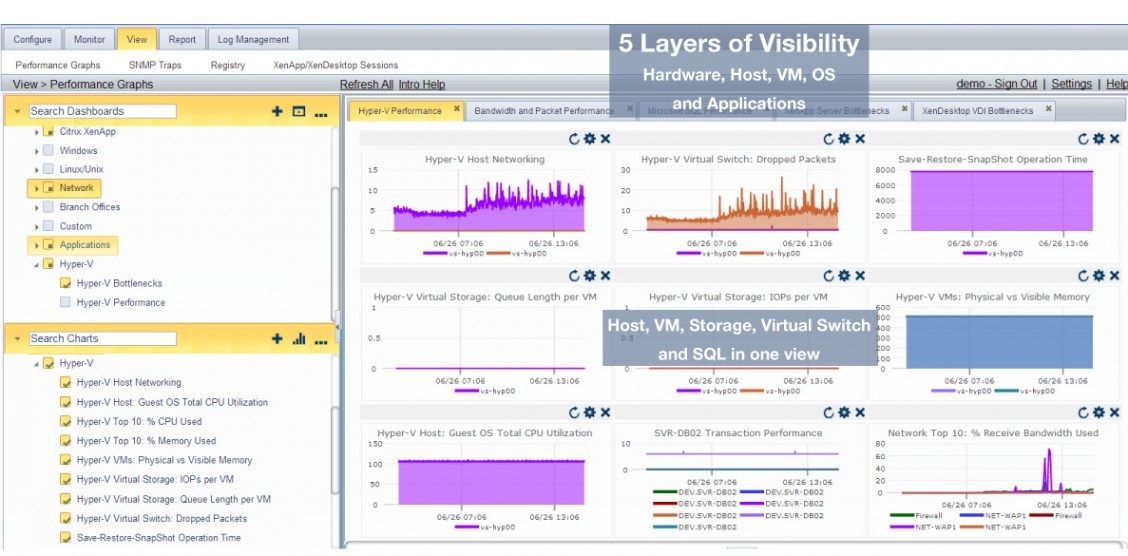
Drill Down into Hyper-V Host, VM, Virtual Switch, and Virtual Storage Performance
You can also simplify and consolidate your IT operations by utilizing other functionality within Goliath Performance Monitor, including proactive performance monitoring for application and desktop virtualization and physical infrastructure.


* Click above for a screenshot tour of Goliath Performance Monitor for Microsoft Hyper-V
Key Features Include:
Host
CPU Utilization
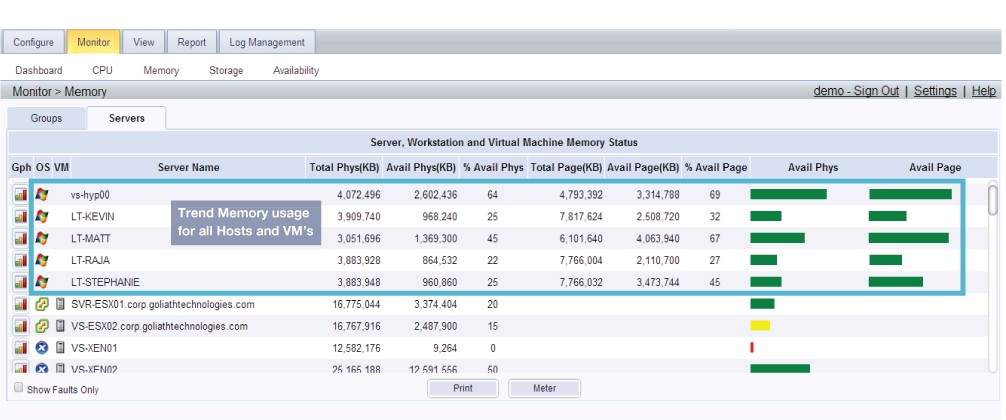
Memory Utilization
Active, Granted, Overhead, Ballooned, Shared, and Swapped Memory
Storage Throughput, Latency, and IOPS
Network Throughput
Virtual Infrastructure Inventory
VM
VM Started, Off, or Paused Status
CPU Utilization and Ready
Memory Utilization
Active, Granted, Overhead, Ballooned, Shared, and Swapped Memory Storage
Disk Throughput, Latency, and IOPS
Network Throughput and Utilization
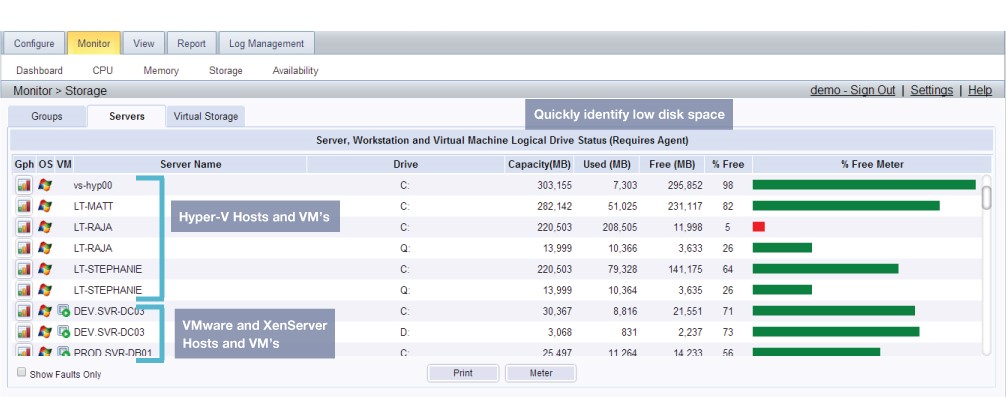
Storage
Utilization
Virtual Disk Size
Snapshots, Orphaned VMs, and Wasted Space
Provisioned, Consumed, and Free Space
Continue Your Research on How to Isolate and Prove Root Cause of End User Experience Issues


